Matplotlib and Seaborn
Table of contents:
It is critical to be able to plot the observations and variables of a dataset before subjecting the dataset to some machine learning algorithm or another. Data visualization is essential to understand your data and to glean insights into the underlying structure of the dataset. This insights helps the scientist in deciding with statistical analysis or which learning algorithm is more appropriate for the given dataset. Also, the scientist can get ideas on suitable transformations to apply to the dataset.
In general, visualization in data science can conveniently be split into univariate and multivariate data visualizations. Univariate data visualization involves plotting a single variable to understand more about its distribution and structure while multivariate plots expose the relationship and structure between two or more variables.
Matplotlib vs. Seaborn
Matplotlib is a graphics package for data visualization in Python. Matplotlib has arisen as a key component in the Python Data Science Stack and is well integrated with NumPy and Pandas. The pyplot module mirrors the MATLAB plotting commands closely. Hence, MATLAB users can easily transit to plotting with Python.
Seaborn, on the other hand, extends the Matplotlib library for creating beautiful graphics with Python using a more straightforward set of methods. Seaborn is more integrated for working with Pandas DataFrames. We will go through creating simple essential plots with Matplotlib and Seaborn.
Pandas plotting methods
Pandas also has a robust set of plotting functions which we will also use for visualizing our dataset. The reader will observe how we can easily convert datasets from NumPy to Pandas and vice-versa to take advantage of one functionality or the other. The plotting features of Pandas are found in the plotting module.
There are many options and properties for working with matplotlib, seaborn and pandas.plotting functions for data visualization, but as is the theme of this material, the goal is to keep it simple, and give the reader just enough to be dangerous. Deep competency comes with experience and continuous usage. These cannot really be taught.
To begin, we will load Matplotlib by importing the pyplot module from the matplotlib package and the seaborn package.
import matplotlib.pyplot as plt
import seaborn as sns
We’ll also import the numpy and pandas packages to create our datasets.
import pandas as pd
import numpy as np
Univariate plots
Some common and essential univariate plots are line plots, bar plots, histograms and density plots, and the box and whisker plot to mention just a few.
Line plot
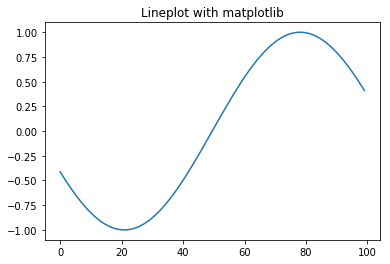
Let’s plot a sine graph of 100 points from the negative to positive exponential range. The plot method allows us to plot lines or markers to the figure.
data = np.linspace(-np.e, np.e, 100, endpoint=True)
# plot a line plot of the sine wave
plt.plot(np.sin(data))
plt.show()
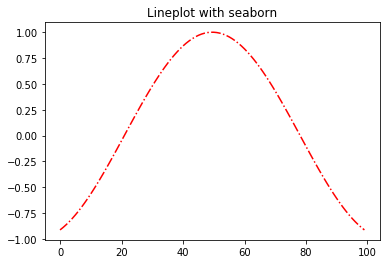
# plot a red sine wave with dash and dot markers
plt.plot(np.cos(data), 'r-.')
plt.show()
Bar plot
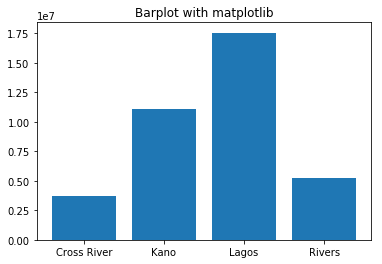
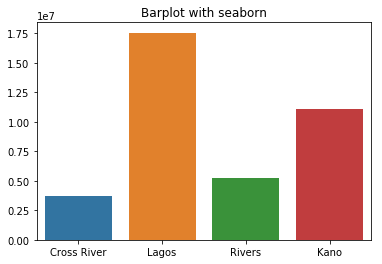
Let’s create a simple bar plot using the bar method.
states = ["Cross River", "Lagos", "Rivers", "Kano"]
population = [3737517, 17552940, 5198716, 11058300]
# create barplot using matplotlib
plt.bar(states, population)
plt.show()
# create barplot using seaborn
sns.barplot(x=states, y=population)
plt.show()
Histogram/ Density plots
Histogram and Density plots are essential for examining the statistical distribution of a variable. For a simple histogram, we’ll create a set of 100,000 points from the normal distribution.
# create 100000 data points from the normal distributions
data = np.random.randn(100000)
# create a histogram plot
plt.hist(data)
plt.show()
# crate a density plot using seaborn
my_fig = sns.distplot(data, hist=False)
plt.show()

Box and whisker plots
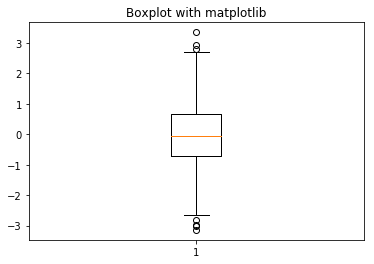
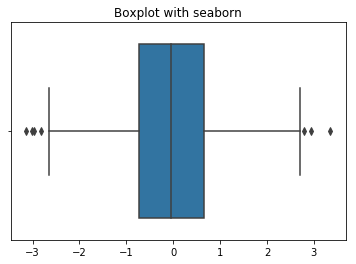
Boxplots, also popularly called Box and whiskers plot is another useful visualization technique for gaining insights into the underlying data distribution. The boxplot draws a box with the upper line representing the 75th percentile and the lower line the 25th percentile. A line is drawn at the center of the box indicating the 50th percentile or median value. The whiskers at both ends give an estimation of the spread or variance of the data values. The dots at the tail end of the whiskers represent possible outlier values.
# create datapoints
data = np.random.randn(1000)
## box plot with matplotlib
plt.boxplot(data)
plt.show()
## box plot with seaborn
sns.boxplot(data)
plt.show()
Multivariate plots
Common multivariate visualizations include the scatter plot and its extension the pairwise plot, parallel coordinates plots and the covariance matrix plot.
Scatter plot
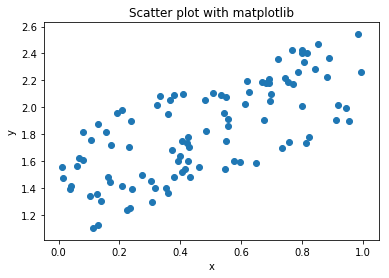
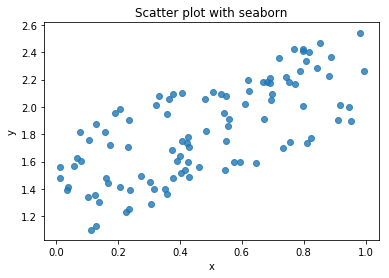
Scatter plot exposes the relationships between two variables in a dataset.
# create the dataset
x = np.random.sample(100)
y = 0.9 * np.asarray(x) + 1 + np.random.uniform(0,0.8, size=(100,))
# scatter plot with matplotlib
plt.scatter(x,y)
plt.xlabel("x")
plt.ylabel("y")
plt.show()
# scatter plot with seaborn
sns.regplot(x=x, y=y, fit_reg=False)
plt.xlabel("x")
plt.ylabel("y")
plt.show()
Pairwise scatter plot
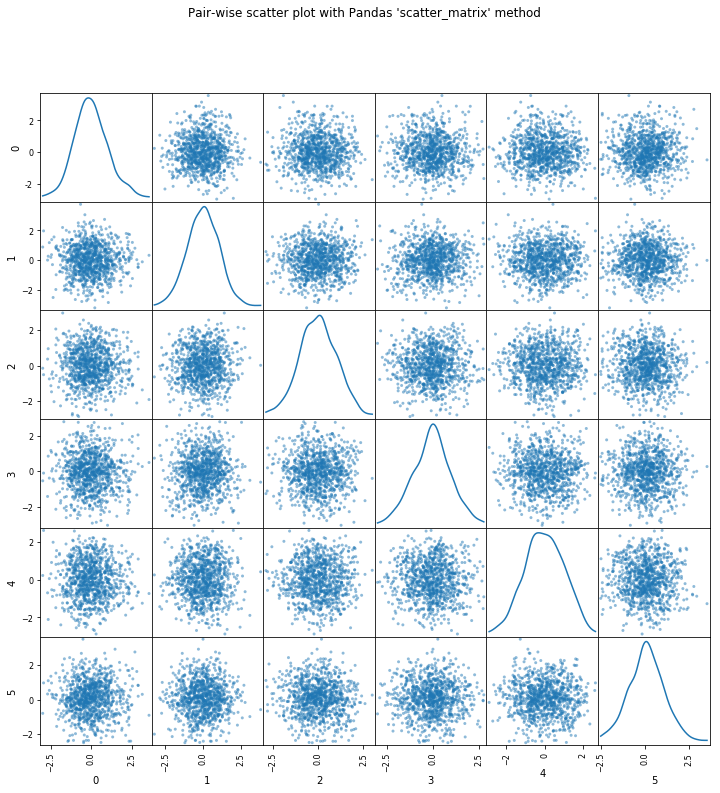
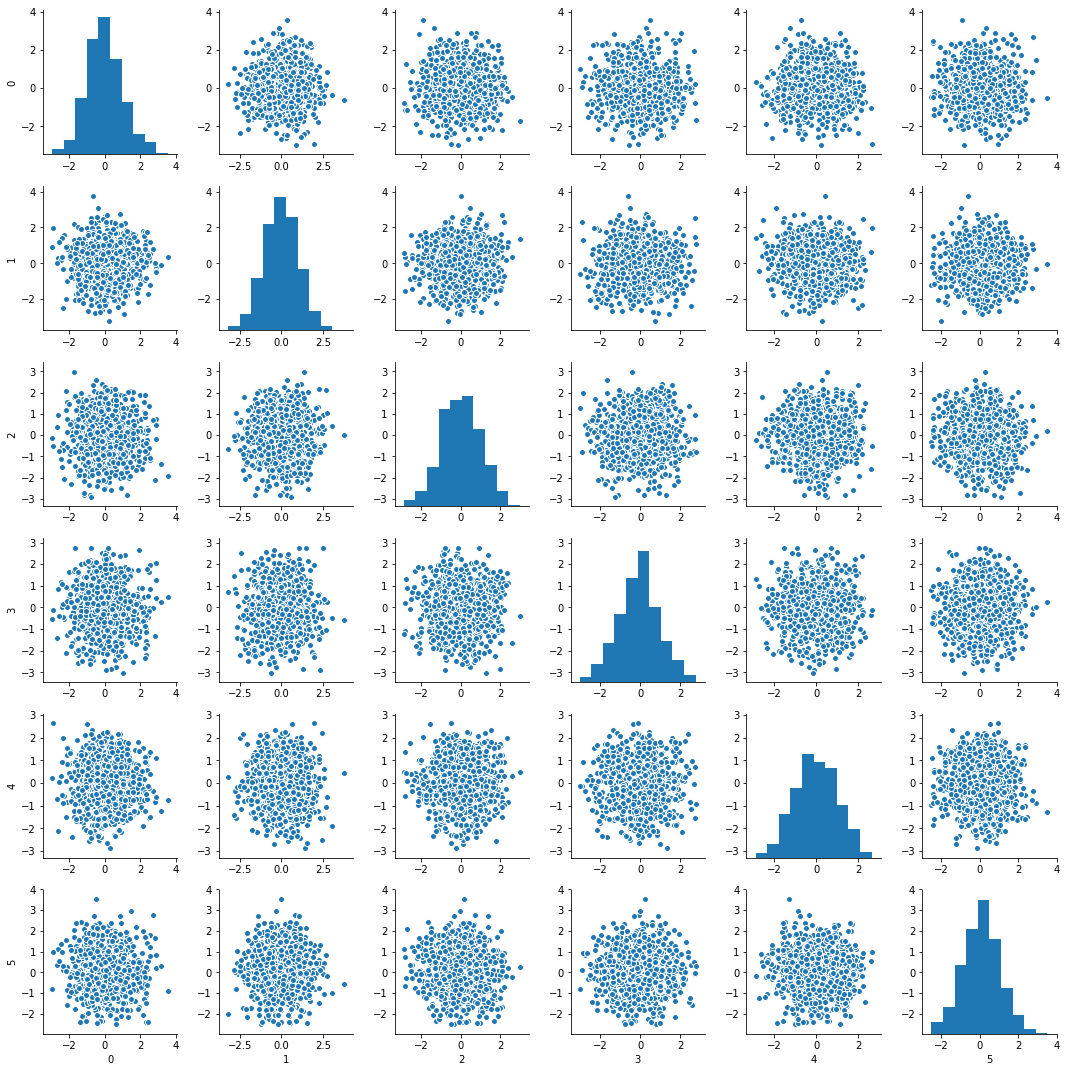
Pair-wise scatter plot is an effective window for visualizing the relationships among multiple variables within the same plot. However, with higher dimension datasets the plot may become clogged up, so use with care. Let’s see an example of this with Matplotlib and Seaborn.
Here, we will use the method scatter_matrix, one of plotting functions in Pandas to graph a pair-wise scatterplot matrix.
# create the dataset
data = np.random.random([1000,6])
# using Pandas scatter_matrix
pd.plotting.scatter_matrix(pd.DataFrame(data), alpha=0.5, figsize=(12, 12), diagonal='kde')
# pairwise scatter with seaborne
sns.pairplot(pd.DataFrame(data))
Correlation matrix plots
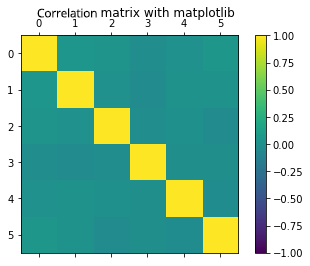
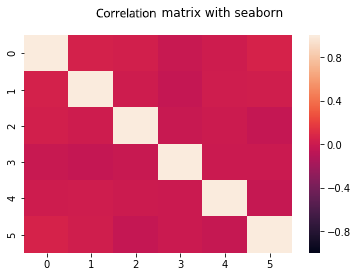
Again, correlation shows how much relationship exists between two variables. By plotting the correlation matrix, we get a visual representation of which variables in the dataset are highly correlated. Remember that parametric machine learning methods such as logistic and linear regression can take a performance hit when variables are highly correlated. Also, in practice, the correlation values that are greater than -0.7 or 0.7 are for the most part highly correlated.
# create the dataset
data = np.random.random([1000,6])
# plot correlation matrix using the Matplotlib matshow function
fig = plt.figure()
ax = fig.add_subplot(111)
my_plot = ax.matshow(pd.DataFrame(data).corr(), vmin=-1, vmax=1)
fig.colorbar(my_plot)

# plot correlation matrix with Seaborne heatmap function
sns.heatmap(pd.DataFrame(data).corr(), vmin=-1, vmax=1)
Images
Matplotlib is also used to visualize images. This processed is utilized when visualizing a dataset of image pixels. You will observe that image data is stored in the computer as an array of pixel intensity values ranging from 0 to 255 across 3 bands for colored images.
img = plt.imread('/Users/ekababisong/Pictures/old-students-logo.jpg')
# check image dimension
img.shape
'Output': (232, 240, 3)
Note that the image contains 232 rows and 240 columns of pixel values across 3 channels (i.e., red, green and blue).
Let’s print the first row of the columns in the first channel of our image data. Remember that each pixel is an intensity value from 0 to 255. Values closer to 0 are black while those closer to 255 are white.
img[0,:,0]
'Output':
array([255, 255, 255, 255, 255, 255, 255, 255, 255, 255, 255, 255, 255,
       255, 255, 255, 255, 255, 255, 255, 255, 255, 255, 255, 255, 255,
       255, 255, 255, 255, 255, 255, 255, 255, 255, 255, 255, 255, 255,
       255, 255, 255, 255, 255, 255, 255, 255, 255, 255, 255, 255, 255,
       255, 255, 255, 255, 255, 255, 255, 255, 255, 255, 255, 255, 246,
       246, 246, 248, 248, 250, 252, 253, 253, 253, 255, 255, 255, 255,
       255, 255, 253, 253, 253, 253, 252, 254, 255, 255, 254, 255, 255,
       255, 255, 254, 255, 255, 243, 246, 248, 252, 253, 252, 250, 248,
       251, 252, 251, 251, 249, 248, 249, 249, 255, 255, 254, 249, 247,
       244, 245, 245, 254, 255, 253, 250, 247, 244, 242, 241, 242, 242,
       242, 243, 243, 244, 244, 244, 252, 251, 250, 248, 247, 245, 245,
       244, 250, 253, 255, 255, 254, 253, 254, 255, 254, 252, 250, 247,
       244, 241, 239, 236, 255, 255, 255, 255, 255, 255, 255, 255, 255,
       255, 255, 254, 253, 251, 251, 250, 255, 255, 255, 255, 255, 255,
       255, 255, 255, 255, 255, 255, 255, 255, 255, 255, 255, 255, 255,
       255, 255, 255, 255, 255, 255, 255, 255, 255, 255, 255, 255, 255,
       255, 255, 255, 255, 255, 255, 255, 255, 255, 255, 255, 255, 255,
       255, 255, 255, 255, 255, 255, 255, 255, 255, 255, 255, 255, 255,
       255, 255, 255, 255, 255, 255], dtype=uint8)
Now let’s plot the image
# plot image
plt.imshow(img)
plt.show()
