Writing
Supervised Machine Learning: A Conversational Guide for Executives and Practitioners
23 August 2017Updated 14 October 202612 min read
A question-and-answer guide to the main decisions in building a supervised learning model, from finding and exploring data to choosing algorithms, evaluating results and improving the model.
This post gives a systematic overview of the main points to consider when building supervised learning models. In a question-and-answer style, we go through the key decisions in building a machine learning or deep learning model. Whether you are an executive or a machine learning engineer, you can use this article to start conversations with each other and communicate more clearly about machine learning.
The field of machine learning changes quickly, and there is so much material available that it can be overwhelming and confusing. Having too many resources can leave you learning very little from any of them. In that situation, it helps to have a guide who puts the pieces together and shows how they fit.
This post gives a high-level rundown of the main steps to follow when building a machine learning model. Aspiring practitioners often ask questions like "How do I begin building machine learning models?" and "What are the key points to consider when working with machine learning?" This article answers these questions. It also helps leaders who are not specialists understand how machine learning engineers approach them.
Where can we find sample datasets?
The first step in machine learning is to have data. As we explained in Machine Learning on the Cloud, there is no learning without data.
Many websites offer free and open datasets for machine learning practice. A few notable ones are:
Before you use a dataset, read its license and its documentation. They tell you what you may use the data for and how it was collected.
Choosing a programming language
The choice of language depends partly on how comfortable the practitioner is with it. However, some languages have more mature machine learning and deep learning libraries than others.
The two languages most used for machine learning are:
- Python
- R
Python is by far the more common of the two. GitHub's Octoverse 2025 report found that Python remains the clear leader in AI repositories on GitHub. The main deep learning frameworks, PyTorch, TensorFlow and JAX, are used mainly from Python. scikit-learn is the standard Python library for classical machine learning. R remains strong in statistics, and tidymodels is a popular R framework for modeling.
A good language for machine learning has a large set of reusable machine learning functions. Experts in the field have written and tested these functions, and a large community of developers maintains and improves them. These functions hide the internals of each algorithm, so the practitioner can think and work at a higher level.
What do we do with big data?
The challenge with big data is its sheer size. With moderately sized datasets, like the ones on the UCI Machine Learning Repository, we load all the data into memory before processing it. We cannot do that with datasets of hundreds of gigabytes, terabytes or petabytes.
The main options for training on big data are:
- Process the data on a cluster of machines with a distributed framework such as Apache Spark.
- Buy dedicated GPU hardware.
- Rent computing power from a cloud provider such as Google Cloud, Amazon Web Services (AWS) or Microsoft Azure.
Each of these providers has a managed machine learning platform: Gemini Enterprise Agent Platform (the successor to Vertex AI), Amazon SageMaker AI and Azure Machine Learning. Read Machine Learning on the Cloud and A Gentle Introduction to Google Cloud Platform for Machine Learning Practice to see why the cloud is a good option for learning on big data.
Exploring the dataset
Before we pass data to any machine learning or deep learning algorithm, we must study the dataset. This means we:
- visualize the data with exploratory plots
- examine the features of the dataset and their probability distributions
Let's look more closely at these steps and why they are necessary.
Visualize the data
We can make two broad types of plots: single-feature and multi-feature.
A single-feature plot shows one feature, or attribute, in the dataset. Examples are histograms and box plots. A multi-feature plot shows two or more features together. Examples are scatter plots and pairwise box plots.
Plots help us spot problems in the dataset that can hurt the model's performance. Two problems to watch for are outliers and skewed data.
Examine the features of the dataset
Most machine learning algorithms work only with numeric inputs. We need to know which features are numeric and which are not.
We can turn categorical features, such as a product type or a country, into numeric variables with a technique called one-hot encoding. Some libraries, such as LightGBM and CatBoost, can also handle categorical features directly. Text, images and audio need other techniques. Today, a common approach is to pass them through a pre-trained model and use the vectors it produces (embeddings) as features.
We may also need to put the features on a similar scale before training. Features on very different scales can slow down training or hurt the performance of many models, including linear models and neural networks. Tree-based models are not affected by scale. One way to rescale a feature is mean normalization, which subtracts the feature's mean from each value and divides by the range or the standard deviation of the feature.
Exploring the data also shows which transformations the features need. If a feature is skewed, we can apply a log transformation to make its distribution closer to a bell curve, also called a Gaussian or normal distribution. We can also apply another power transform, such as the Box-Cox transformation. This often improves the accuracy of linear models.
Compute every value used in these steps, such as means, standard deviations and category lists, from the training data only. Then apply the same transformation to the validation and test data. If information from the test data leaks into training, the evaluation will look better than the model really is. scikit-learn's pipelines help prevent this, and its guide to common pitfalls explains the problem in detail.
Dealing with outliers
When we find an outlier, we should investigate the reason for it. It may be a data entry error, an instrument malfunction or a measurement error. In that case, we can correct or remove it, because such errors can hurt the model's performance. Some outliers are real and important, such as a fraudulent transaction, and the model needs to learn from them.
Dealing with missing values
Many machine learning and deep learning algorithms give poor results or raise errors when the data has missing values. We need a strategy for missing values before we train the model.
Common strategies include:
- replacing a missing value with the mean or median of its feature, which is called imputation
- predicting the missing value from the other features with a model
- removing the examples with missing values, if enough data remains
Split the dataset into training, validation and test sets
The goal of machine learning is to predict or classify outcomes correctly on examples the model has not seen. If we evaluate a model on the same examples we used to train it, we will misjudge its performance. To learn more about this, read Understanding Machine Learning: An Executive Overview.
To evaluate a learning algorithm properly, we set aside some data for testing. This held-out data is called the test set.
We also need data to tune the model. After we train a model, we usually adjust some of the learning algorithm's hyperparameters to improve it. We cannot use the test set for this. If we tune the model on the test set, the model learns the test set and we can no longer use it for evaluation. So we divide the dataset into three parts:
- the training set, to train the model
- the validation set, to tune the model
- the test set, to evaluate the final model
When the dataset is small, we can use cross-validation in place of a single validation set. Cross-validation splits the training data into several folds and trains and evaluates the model several times, holding out a different fold each time.
How we split also matters. If the data is ordered in time, such as sales or sensor readings, train on the past and test on the most recent period. If the same customer or patient appears many times, keep all of their records in the same set.
What are predictor and response variables?
Predictor variables are the variables we use to train the model so that it predicts or classifies the outcome correctly. They are also called input variables or features. The outcome variable is also called the response or target variable. A learning problem can have many input variables but typically has only one target variable.
From the learning problem, we decide which variables are inputs and which one is the target. The type of the target variable guides our choice of candidate algorithms and of the evaluation metric. If the target is categorical, the learning problem is a classification problem. If the target is real-valued, the learning problem is a regression problem.
Choosing candidate algorithms
There are many machine learning and deep learning algorithms. The points below can guide the practitioner in choosing the algorithms that suit the learning problem.
A practitioner does not need to know every mathematical detail of an algorithm. However, we should be able to answer these questions about any algorithm we use:
- How does the algorithm work, at least at a high level?
- In what cases does the algorithm perform best?
- What are the limitations of the algorithm?
- How do we interpret the results of the algorithm?
Three guidelines help us select algorithms that perform well on the dataset:
- The underlying structure of the data
- The type of the target variable
- The type of data
Let's look briefly at each guideline.
-
The underlying structure of the data. Supervised learning algorithms fall into two broad classes, linear and nonlinear. Linear methods assume that the relationship between the features and the target is linear. Nonlinear methods make no such assumption. If the relationship in the dataset is linear, we are better off with a linear algorithm. A quick way to check for linearity is to plot a pairwise scatter diagram of the variables.
Linear methods sometimes do well even when the relationship in the data is nonlinear. This happens most often when the data is small or noisy, because a simpler model is less likely to learn the noise. This idea relates to Occam's razor, which says we should prefer the simpler of two models that explain the data equally well. We discuss this further in the section on the bias and variance trade-off.
As a rule of thumb, include at least one linear method, such as linear or logistic regression, among the candidate algorithms. It gives a baseline for comparing more sophisticated nonlinear algorithms.
-
The type of the target variable. Some algorithms predict real-valued outputs, such as linear regression. Others classify the target into categories, such as logistic regression. The learning task narrows the set of algorithms we consider.
-
The type of data. For tabular data, such as spreadsheets and database tables, tree-based ensembles are strong candidates. A 2022 benchmark by Grinsztajn and colleagues found that tree-based models such as XGBoost and random forests outperformed deep learning on medium-sized tabular datasets. For text, images and audio, deep learning works best. In practice, we usually start from a pre-trained foundation model and fine-tune it on our labeled examples. Fine-tuning is itself a form of supervised learning.
Bias and variance trade-off
Bias and variance are central to machine learning. They tell us how a model is performing and how best to improve it.
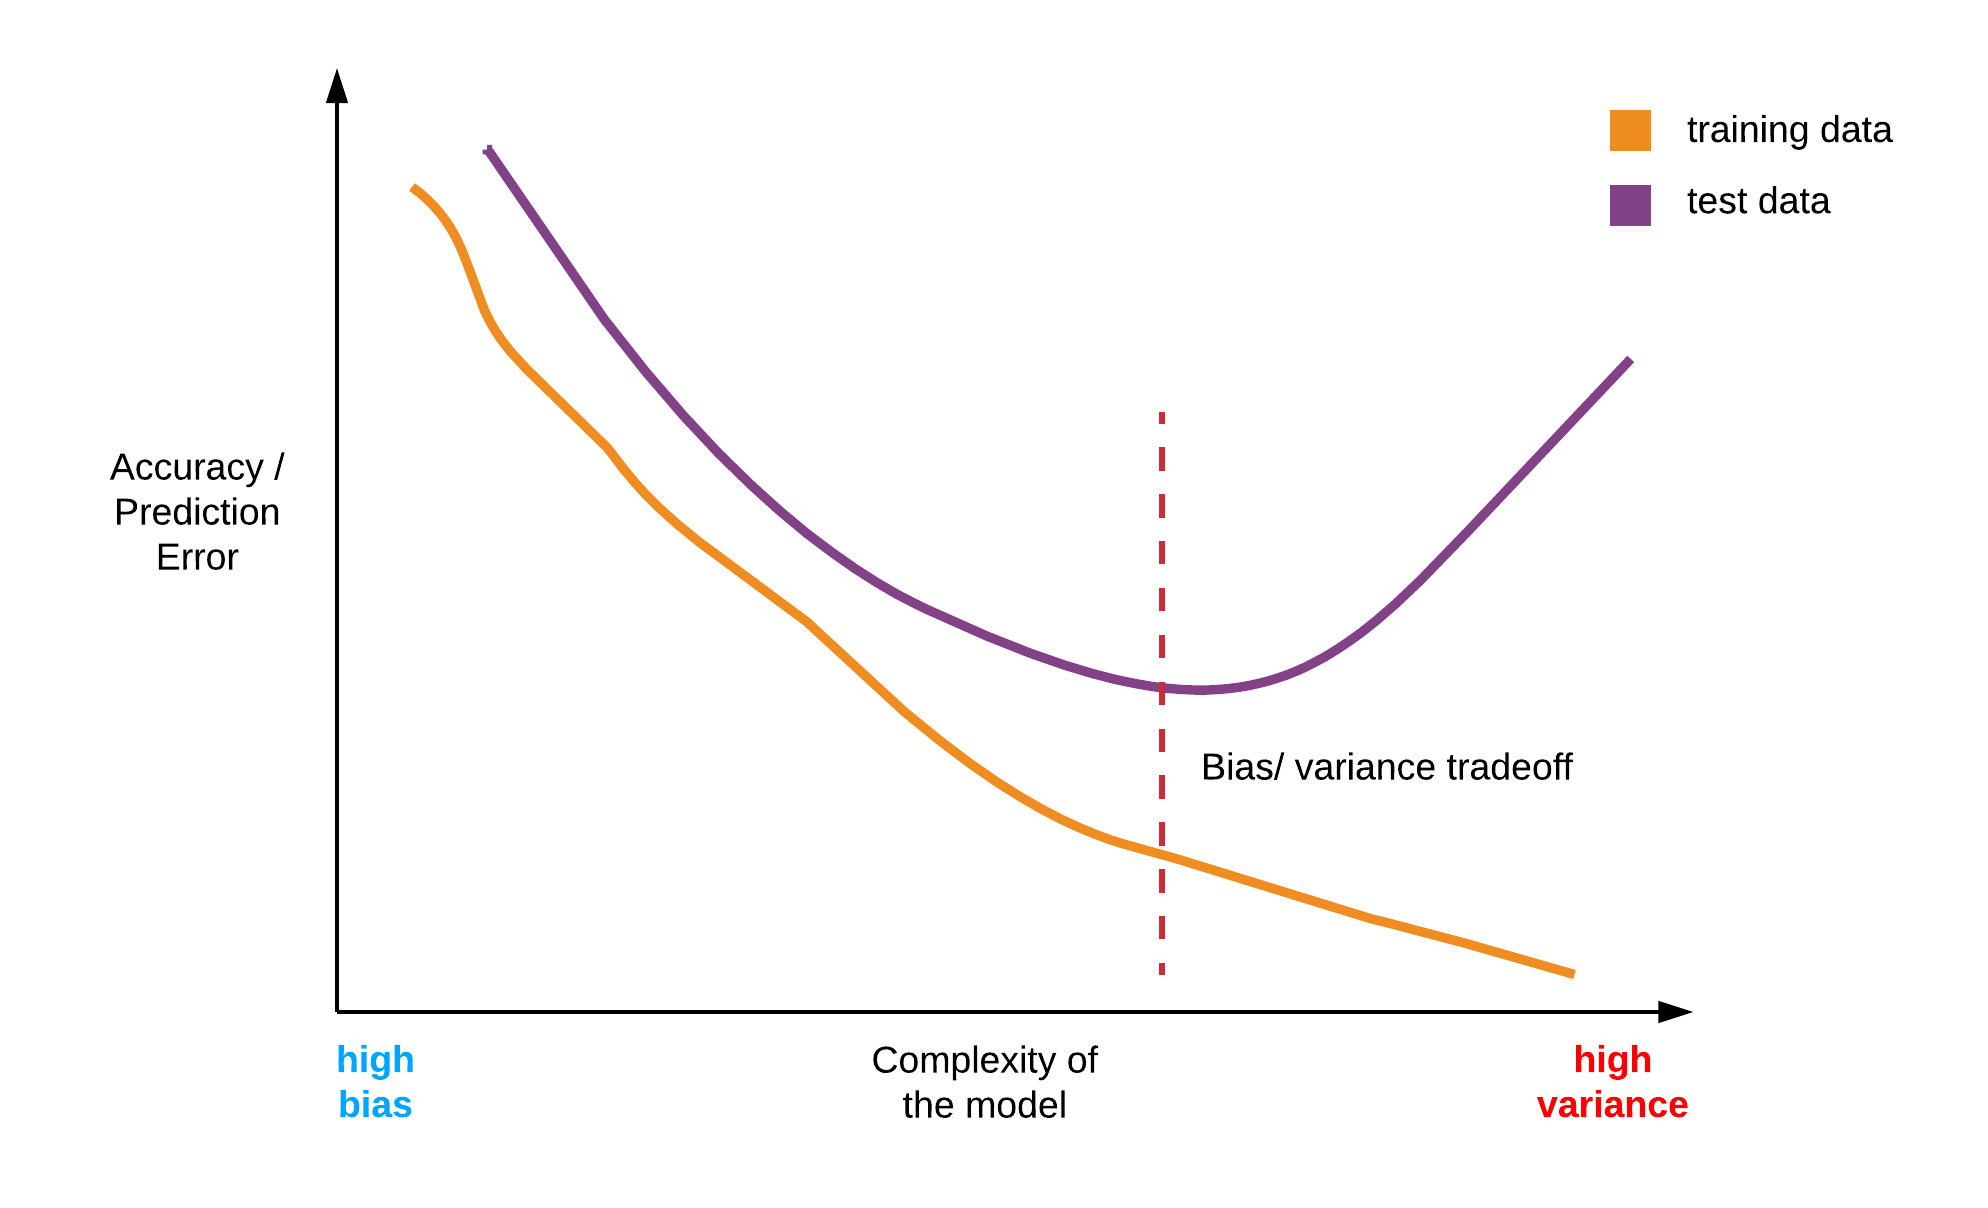
Bias is the error that comes from a model that oversimplifies the learning problem. The model fails to capture the complex relationships in the dataset, so it performs poorly on both the training data and new examples. Variance is the error that comes from a model that learns the training data too closely. In the process, it learns the random noise present in every dataset. A model that has learned the noise in the training data fails to generalize to unseen data.
There is a constant tension between bias and variance, and the model builder must find the middle ground. This balance is different for every dataset. However, some practical rules of thumb help.
Common causes of bias
- using an overly simple algorithm for nonlinear data
- setting the regularization parameter too high
- using too few features to capture the learning problem
Common causes of variance
- using too many features compared with the number of examples
- training on too few examples
- tuning the hyperparameters of a nonlinear algorithm until it becomes so flexible that it learns the noise in the dataset
- using no regularization, or very little
How do we recognize bias or variance in the results?
High bias shows when the model performs poorly on the training data. It also performs poorly, or even worse, on the test data. High variance shows when the model performs very well on the training data but poorly on unseen test data.
How do we know that the model is performing well? Choosing an evaluation metric
Evaluation metrics tell us how well our models are doing. We evaluate the model on the training data to get its training performance. We evaluate it on the test data to learn how it performs on unseen examples. Comparing the two tells us whether the model performs well or suffers from bias or variance.
The learning problem determines the evaluation metric. For regression problems, we often use the mean squared error (MSE) or the mean absolute error (MAE). For classification problems, a confusion matrix shows how many examples the model classified correctly and how many it misclassified. From the confusion matrix, we can compute other useful metrics such as accuracy, precision, recall and the F1 score. When one class is rare, such as fraud, accuracy can mislead, and precision and recall give a clearer picture.
Choose the metric that matches the business goal, and use the test set only once, for the final evaluation. After deployment, keep measuring the model on new data. Its performance can drop as the world changes.
Improving the model
To improve the model, we can try several techniques and compare them on the validation set or with cross-validation:
- Systematic feature engineering
- Ensemble methods
- Hyperparameter tuning
Let's look at each option.
-
Feature engineering. Practitioners usually spend much of their time on feature engineering. Feature engineering is the practice of studying each feature in the dataset and how it relates to the target variable. With the insight we gain, we can create new features by combining existing ones. Good features can improve prediction accuracy a great deal. In machine learning competitions, the quality of feature engineering often separates a good model from a winning one.
-
Ensemble methods. Ensemble methods combine the outputs of several models to produce a stronger model. Two major classes of ensemble methods are:
- Bagging, as in random forests
- Boosting, as in gradient boosted trees
Random forests and gradient boosting libraries such as XGBoost, LightGBM and CatBoost do very well on many problems and are popular with competitors in machine learning competitions. Try ensemble methods on your problem and compare them with your other candidate algorithms.
-
Hyperparameter tuning. When we apply a learning algorithm, we can adjust some of its settings. These settings are called hyperparameters because they belong to the learning algorithm. The model's own parameters are the values it learns from the data. We can search for the hyperparameters that give the best validation performance with a grid search, a random search or a library such as Optuna that chooses the next settings to try based on earlier results.
That is all for now!
Thanks for reading, and thanks to Paul Spiegelhalter for the technical review of the content.

Ekaba Bisong is a Ph.D. researcher at the University of Victoria and the founder of SiliconBlast. More about me